
Stratifying a sample enables you to easily breakout survey results by different segments of your population. Look at the tables below to see how it’s done.
Aggregated results allow you to make claims such as, “20% of respondents work for manufacturing firms.” It may be helpful to look deeper and determine the characteristics of the manufacturing firms. You might discover that “of the 20% who work for manufacturing firms, 90% work for companies with more than 100 employees.” Then you could focus on this group’s answers to other questions.
Unfortunately, if not enough respondents work for a manufacturing firm, the sampling error will be so large that analysis on the segment will be impossible. Stratifying the sample can help. When a sample is stratified, various segments of interest are identified before sample selection and a sufficient quantity of names is chosen from each.
Let’s look at the breakdown of a population by the company type: Manufacturing: 10% – Distribution: 30% – Retail: 60%
Without stratifying the sample, you would expect to receive the same proportion of responses as the population.
Here is a scenario for a study collecting 600 total responses:
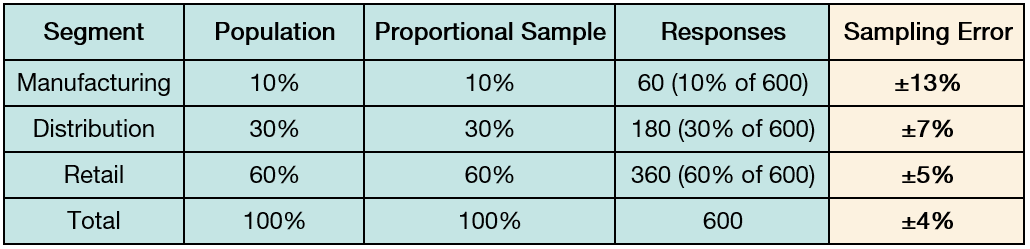
Considering the large sampling error figure, the data shouldn’t be used to describe the typical manufacturing respondent. You could increase the size of the total sample by a factor of three (the number of manufacturing responses should increase threefold), but your survey now costs about three times as much.
A more attractive option is to stratify the sample—grouping the names by company type before sampling, and then selecting a specific number of names from each segment (rather than in proportion to the actual population totals).
This is one possible scenario of stratifying a sample and its impact:
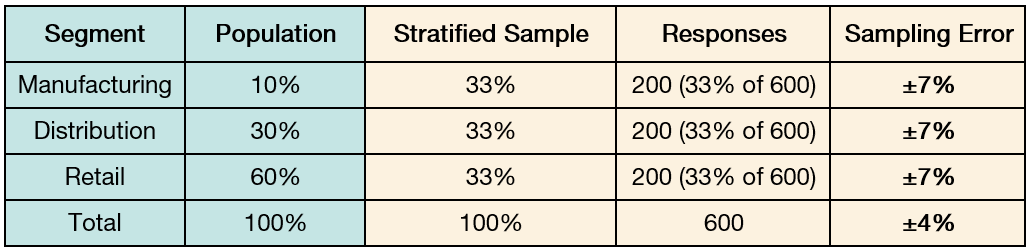
Collecting an equal number of responses from each segment provides the same sampling error figure for each. The small sacrifice in precision for retail (±5% vs. ±7%) is more than offset by the increased precision for manufacturing.
Now you can look at segment-level results with confidence. In the report, “total” results are weighted to true population proportions so that the categories with fewer members are not over-represented in the totals.
Stratifying your sample is an affordable way to examine the characteristics of specific segments while still getting data that accurately reflects the overall characteristics of your population.


